
What is P-Value and Why is P 0.05 So Important?
In the world of statistics, there are some concepts that are important to understand for anyone analyzing data. One such concept is the p-value. While it might sound complicated at first, the p-value is actually a simple measure that helps us determine the significance of results in statistical testing. In this blog post, we will break down what the p-value is, how it works, and why the threshold of p 0.05 is so commonly used in scientific research. By the end, you’ll have a clear understanding of p-values and how to interpret them in various contexts.
What Does “P 05” Mean?
Now, let’s focus our understanding on the term p 05 (or p = 0.05). This is a common significance level used in many fields of research. When you calculate the p-value in an experiment and it equals 0.05, this means there is a 5% probability that the observed results are due to random chance.
In other words, if you get a p-value of 0.05 or less, it suggests that there is enough evidence to reject the null hypothesis and accept the alternative hypothesis. It indicates a statistically significant result. On the other hand, if your p-value is greater than 0.05, you would typically fail to reject the null hypothesis, meaning the observed effect could be due to chance.
Understanding P-Value
What Exactly is a P-Value?
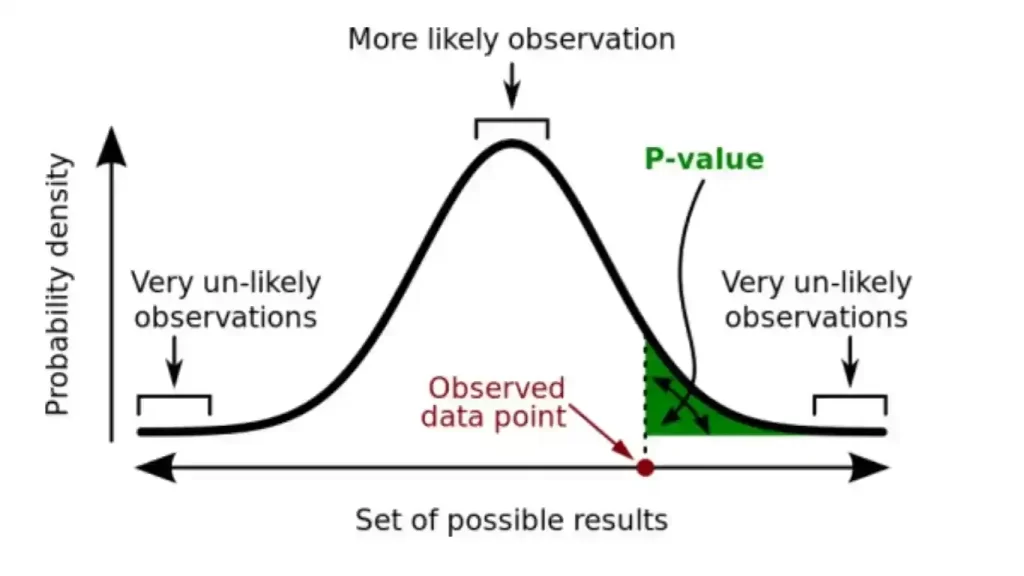
In basic terms, a p-value is a number that helps researchers determine whether their hypothesis test results are statistically significant. It measures the probability of obtaining results at least as extreme as the ones observed, given that the null hypothesis is true.
Let’s break that down with a simple example. Suppose you’re testing whether a new drug is effective in lowering blood pressure. The null hypothesis would be that the drug has no effect. After conducting your experiment and analyzing the data, you would calculate the p-value. This p-value indicates the probability that the results of your study happened by chance.
How to Interpret p 05 or p-value?
Now that you know what a p-value is, let’s talk about how to interpret it. A p-value can range from 0 to 1.
If the p-value is low, it suggests that the observed data is unlikely under the null hypothesis, and therefore, you might reject the null hypothesis.
If the p-value is high, it suggests that the observed data is more likely under the null hypothesis, meaning you do not have enough evidence to reject it.
The p-value of 0.05 is often seen as the magic number. However, it’s essential to understand that it doesn’t necessarily indicate the quality or the importance of the findings. Let’s break this down:
P-value ≤ 0.05: The results are considered statistically significant. There is strong evidence to reject the null hypothesis.
P-value > 0.05: The results are not statistically significant. You do not have enough evidence to reject the null hypothesis.
P-value ≤ 0.01: This is considered even stronger evidence against the null hypothesis. The smaller the p-value, the stronger the evidence.
P-value ≥ 0.10: This suggests weak evidence, and researchers typically refrain from drawing any strong conclusions.
Why P 0.05 is So Important
The 0.05 Threshold
When researchers say p 0.05, they are referring to a threshold of 0.05 or 5% for the p-value. This means that if the p-value is less than or equal to 0.05, the results are considered statistically significant, and the null hypothesis is rejected. In other words, there is only a 5% chance or less that the observed result happened by random chance.
For example, if you’re conducting a clinical trial to test whether a new medication reduces symptoms of a disease, and your p-value comes out to be 0.03, this would mean that there’s only a 3% probability that the result happened by chance. Since 0.03 is less than 0.05, you would reject the null hypothesis and conclude that the drug has a significant effect.
A Convenient Cutoff
The p-value threshold of 0.05 has become a standard in the scientific community largely because it provides a balance between Type I and Type II errors.
Type I error occurs when you incorrectly reject a true null hypothesis (a “false positive”).
Type II error occurs when you fail to reject a false null hypothesis (a “false negative”).
By setting the threshold at p 0.05, researchers are saying they are willing to accept a 5% chance of making a Type I error. This level of risk is often deemed acceptable, especially in fields where the stakes aren’t extremely high (such as in social sciences or basic research).
How to Calculate P-Value
The Role of Test Statistics
The calculation of the p-value depends on the type of test you are conducting. For example, if you are doing a t-test, the p-value will be calculated based on the test statistic (t-value) and the degrees of freedom. The formula can get a bit complex, but in simple terms, you’re essentially finding the probability of seeing a test statistic as extreme as the one calculated from your data, assuming the null hypothesis is true.
Software and Tools
Thankfully, most statistical analysis is now done with the help of software like SPSS, R, Python, and Excel. These programs automatically calculate p-values for you, so you don’t have to do the math by hand. All you need is your data and the right statistical test, and the software will do the rest.






Common Misconceptions About P-Value
While the p-value is an essential tool in statistics, it’s not without its controversies and misconceptions. Let’s clear up a few common misunderstandings.
P-Value is Not the Probability of the Null Hypothesis Being True
One of the most common misconceptions is that the p-value tells us the probability that the null hypothesis is true. This is incorrect. The p-value tells you how likely your data is, given that the null hypothesis is true—not the probability of the hypothesis itself.
A P-Value Greater Than 0.05 Does Not Prove the Null Hypothesis is True
Another misunderstanding is that if the p-value is greater than 0.05, it means the null hypothesis is true. That’s not quite right either. A p-value greater than 0.05 simply means that there is insufficient evidence to reject the null hypothesis. It does not prove that the null hypothesis is true.
P-Value is Not the Only Measure of Evidence
While p-values are useful, they shouldn’t be the sole factor in decision-making. Researchers often combine the p-value with other statistics, such as confidence intervals, to draw more accurate conclusions. Using the p-value alongside other measures can give a more complete picture of the data.
The Importance of P-Value in Research
Significance in Scientific Studies
The p-value is vital in almost every field of scientific research, from medical studies to economics. By allowing researchers to assess the likelihood that their results are due to random chance, the p-value provides a level of confidence in the conclusions drawn from data.
In medical research, a statistically significant p-value can mean the difference between approval for a new drug or treatment.
In psychology, a p-value helps psychologists determine if their experimental results are meaningful or simply due to chance.
In business, analysts may use p-values to determine if marketing strategies or new products are likely to succeed.
P-Value in Decision-Making
Researchers and decision-makers use the p-value as a way to justify action. For example, a p-value less than p 0.05 might indicate that a new business strategy is worth pursuing because the results are statistically significant. However, it’s always important to remember that the p-value is just one piece of the puzzle.
The Role of P-Values in Hypothesis Testing
In hypothesis testing, you start with two competing hypotheses:
Null Hypothesis (H0) – This hypothesis assumes there is no effect, relationship, or difference in the population being studied.
Alternative Hypothesis (H1) – This is the hypothesis you aim to prove, which suggests that there is a significant effect or relationship.
Once you perform the test and calculate the p-value, you compare it to a pre-set significance level (usually 0.05). This significance level is often referred to as alpha (α), and it represents the threshold below which you would consider rejecting the null hypothesis.
Final Thoughts
In conclusion, the p-value is a critical concept in statistics that helps researchers determine whether their findings are statistically significant. Understanding the p 0.05 threshold is key, as it helps you assess the likelihood that your results are due to chance. While p-values are useful, they should not be the sole basis for drawing conclusions, and researchers should always be mindful of the broader context in which they are working. In the end, the p-value is an essential tool, but it’s just one part of the larger picture of scientific discovery.
FAQs
See More
Global Strategic Ecosystem
Synchronize with our verified professional networks for high-impact technical guidance and instant TCC community updates.
You may find more information related to What is P 05 Value?


